© J.H.Mathieson

Map Styles:
The most common map styles used
in the study of surname
distributions are the proportional
symbol and area fill maps. Each
form has its strengths and
weaknesses. Area fill maps have
the advantage that
it is easy to interpret values as each colour represents a range of values. What it doesn't do
as well is give a sense of the variation in the intensity of a distribution. By contrast,
proportional symbol maps portray distributions well, but the values are often more difficult to
interpret.
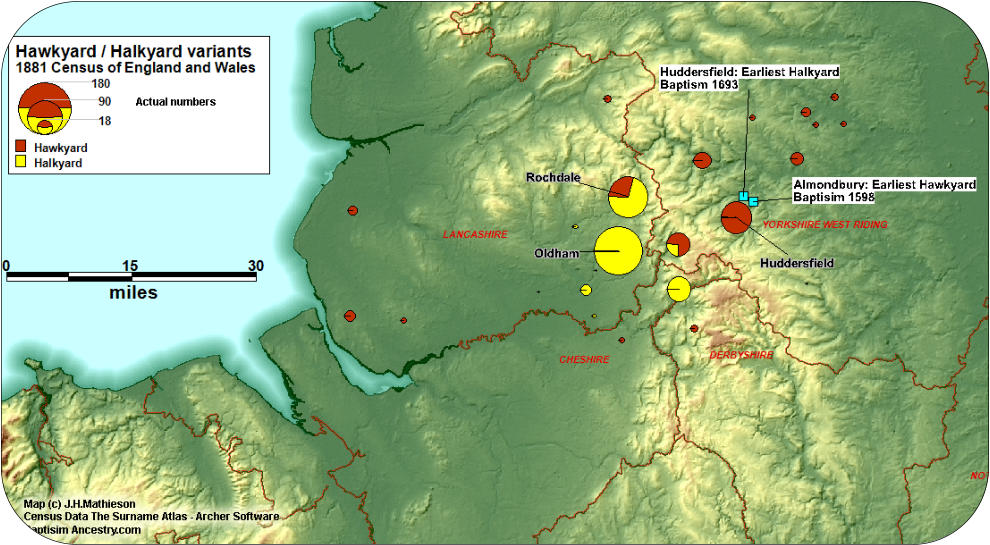
Compound symbol maps can be very valuable when sorting out variants. Are two surnames
related or did they evolve independently? Which one was the original which one was the
variant? When two surnames where the spelling appears
similar can be found spatially associated, there is a very
good chance they are related. As an example we can
illustrate the point with the Halkyard and Hawkyard
surnames. The spellings are very similar. An “l” has been
substituted for a “w”, or visa versa. This could be the result
of a transcription error or a misinterpretation due to dialect.
If the errant spelling becomes fossilized a new surname variant is born. In the case of the
Halkyard/Hawkyard question a Halkyard baptism took place in 1598 in Almondbury, and the
earlies Hawkyard baptism took place in adjacent Huddersfield in 1693. It may be Halkyard is
the original surname form.
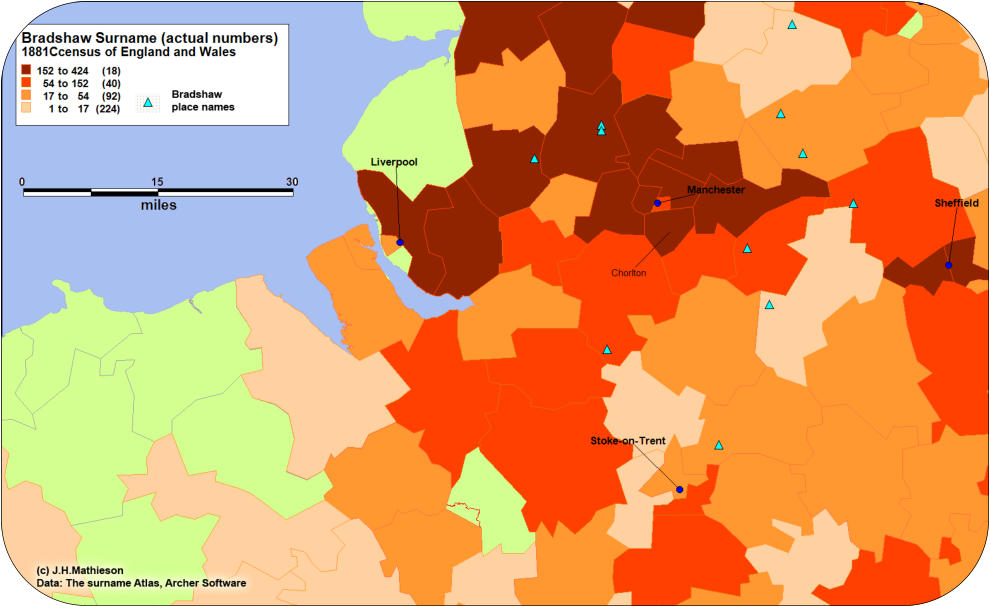
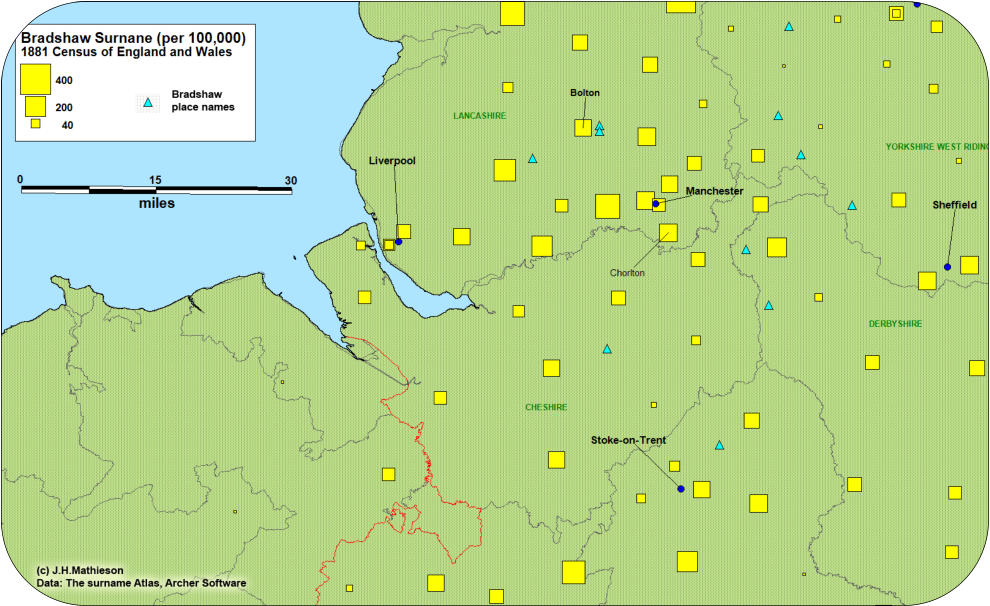
Standardized Data:
Surname distributions are displayed by aggregating the frequency of surnames at specific
locations. The most basic approach displays the distribution using raw numbers. While this is
a perfectly acceptable methodology it is often useful to standardize data using “ratios”. For
example surnames with a high frequency and widespread distribution, will reflect the impact
of urbanization when using raw numbers . To eliminate this bias, a distribution can be
“standardized” to take into account the relative size of the population within a given area. A
surname could be expressed as
X/100,000 population. The
examples to the right illustrates
the principle using the
Bradshaw surname. Using raw
numbers the surname
distribution in the Liverpool
Manchester region appears to be much higher when compared with a standardized
distribution. The origin of the Bradshaw surname can likely be attributed to the numerous
places called Bradshaw most of which are found some distance from the two urban centrers.
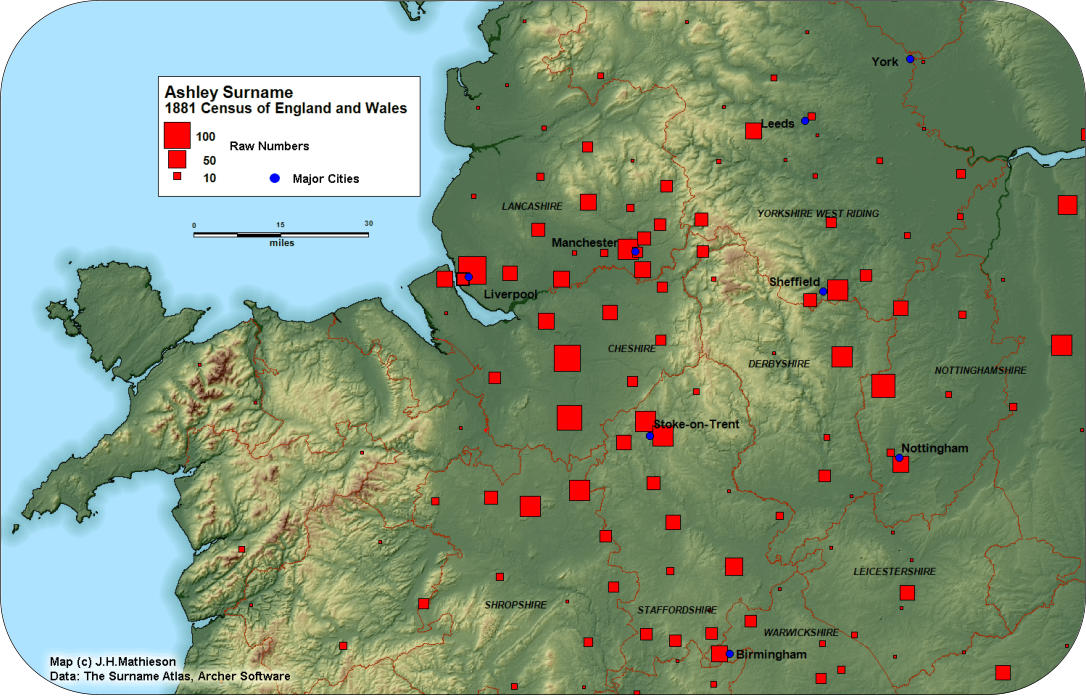
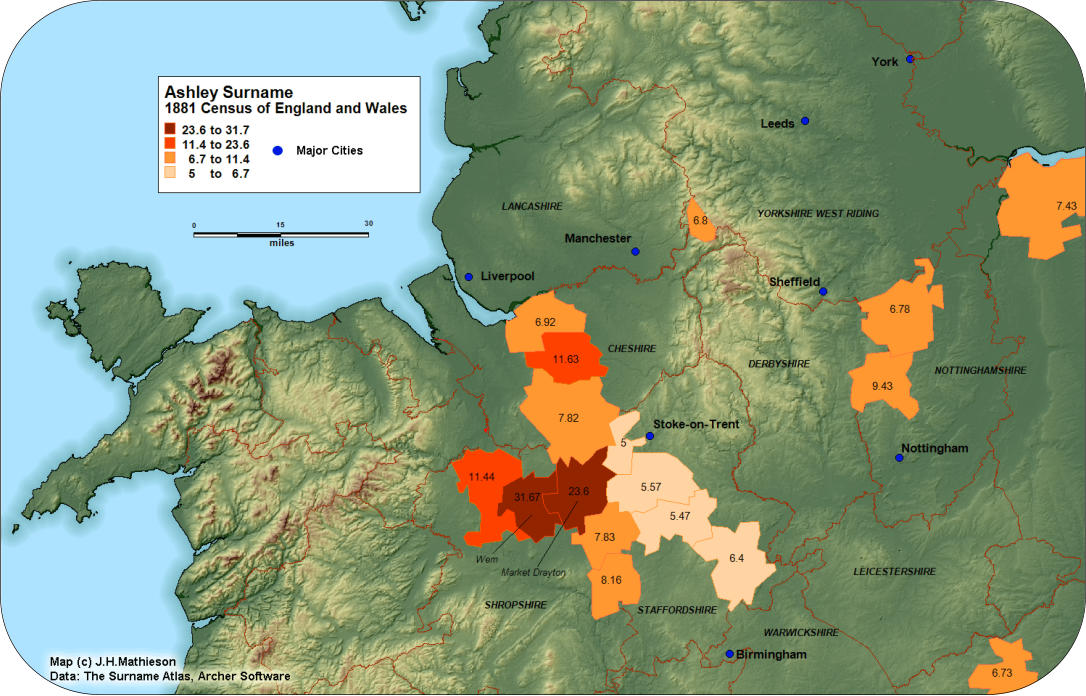
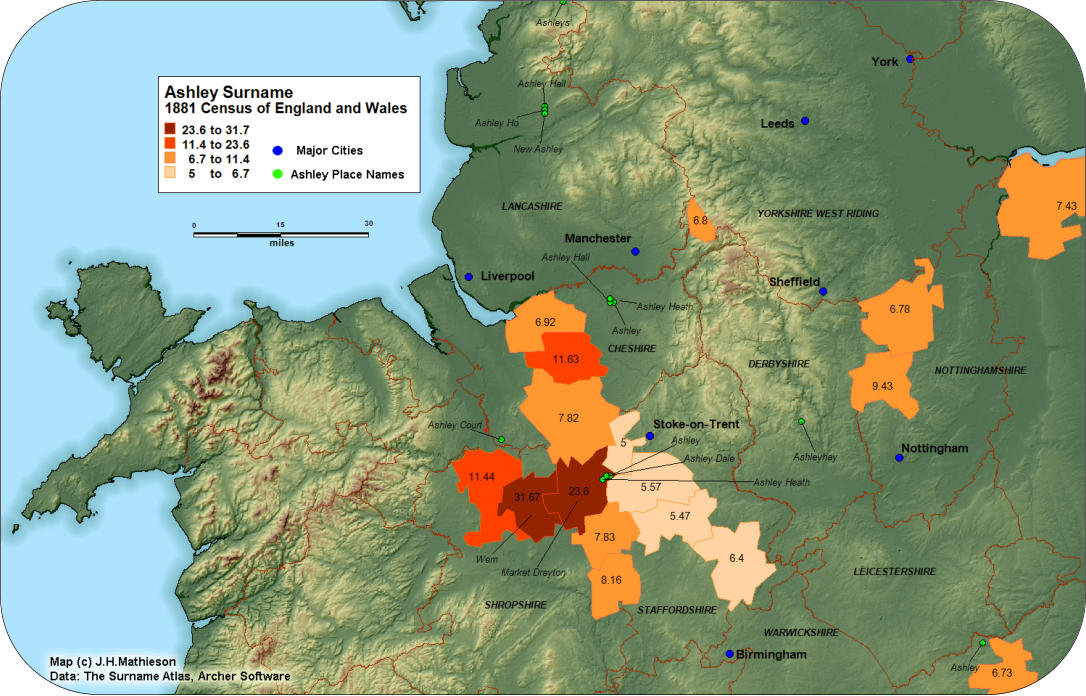
The Banwell Index:
The late Guild of One Name Studies member Eric Banwell
introduced the “Banwell Index” to the study of surnames. Intensity
indexes are widely used in geographic studies. The Banwell Index
(BI) compares the frequency of a surname within an areal sub
region, to the frequency within a larger area. If a surname’s
incidence was calculated to be 1.2% of the national population, and
the incidence within a Registration District was 4.8%, the BI would
be 4.8% / 1.2% = 4.4. By plotting Banwell Indexes it is possible to
identify significant regional concentrations of a surname. The
Ashley surname can be used to illustrate the application of the
Banwell Index. With an 1881 frequency of 5,005 the surname is
concentrated in the English Midlands. Derived from a place name
or a wood, there are likely several origins. We can filter out the
distributions “noise” by plotting the BI with a value >= 5. The
Registration Districts of Wem (31.7), and Market Drayton (23.6),
constitute the core of the Ashley distribution in the West Midlands.
The place names of Ashley and Ashley Court are found nearby.